Analytics
The analytics area allows detailed reporting on a variety of system actions which can be broken down by user group and filtered by a number of options.
Creating a new report
To create a new analytics report go to Analytics, under the Admin menu. Reports are specific to your user account - other users won't see your reports unless you choose to create a dash tile.
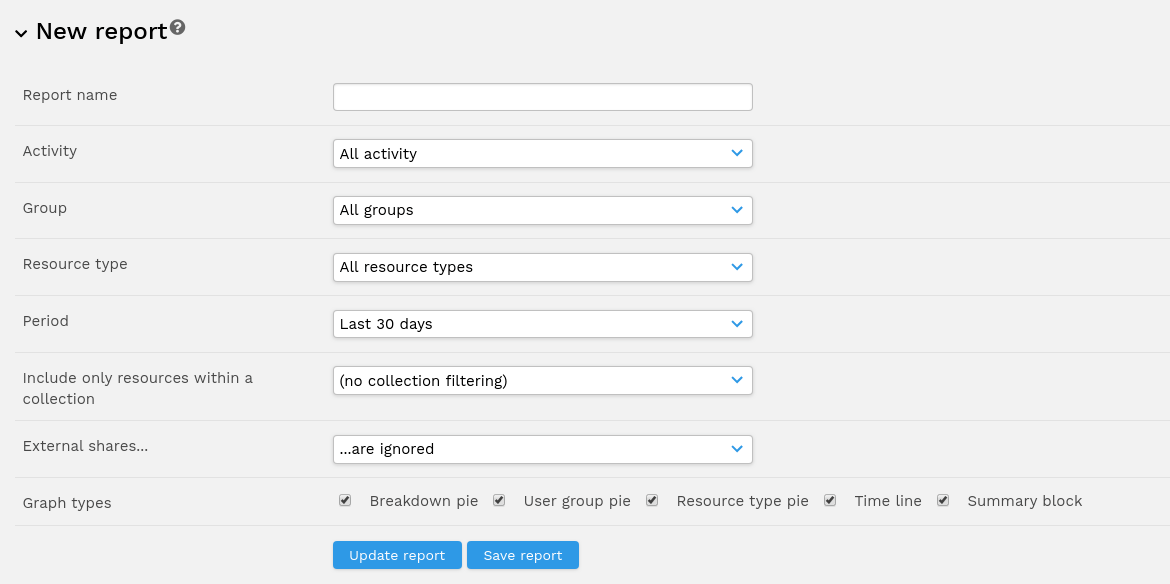
Report options
- Report name - the report name as displayed in your managed list
- Activity - the type of activity that you wish to report on - by default, all activities are displayed, producing a broad report
- Group - allows you to filter to show the activity of users in a particular user group or groups (multi-select)
- Period - filters to show activity in the last X days or a specific date range. Note that if you are going to create a dash tile from this report it is more useful to filter by number of days rather than a fixed date range to create a dynamic report.
- Collection filtering - select one of your own collections or a Featured Collection to show only activity related to resources in the selected collection.
- External shares - select whether resource activity from external shares is included in the data. Options are:
- "...are ignored" - do not report at all on any actions performed when the user was accessing via an external share link
- "...are combined with the user group of the sharing user" - any actions performed via external share links are treated as if it is the sharing user that is performing the action
- "...are reported as a separate user group" - actions performed via external share links are reported separately, just as if there is a dedicated user group for all external share activity
- Graph types - Limit the report to a specific type of graph
- Breakdown pie - (if applicable) for certain activities a breakdown by the object that the action was performed on can be shown.
- User group pie - a pie chart breaking down activity by user group
- Time line - A line graph of activity over time for the selected period
- Summary block - total figures for activity
Report description
For each selected activity type a report block will be displayed summarising that activity for the selected period / group / collection (etc.) as selected.
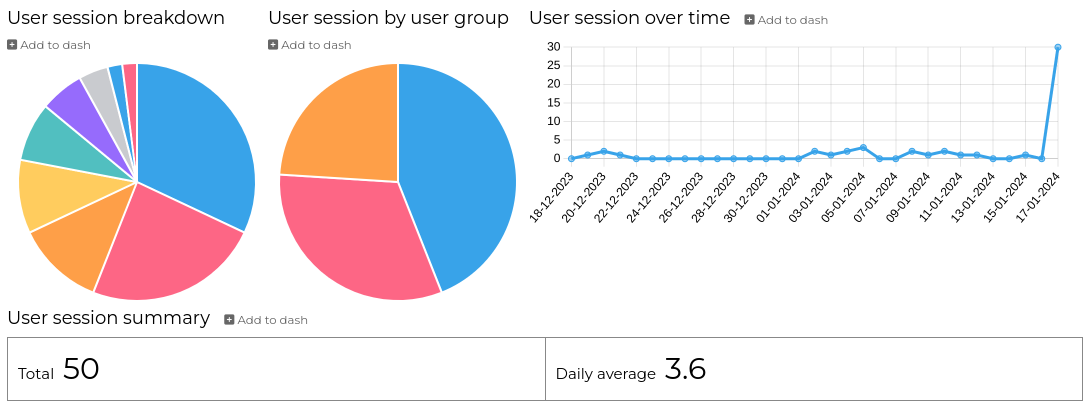
Hovering over the pie charts with your mouse will display the name of the selected segment. Likewise, hovering over the points on the line graph will display the exact date and action count.
Add report to dash
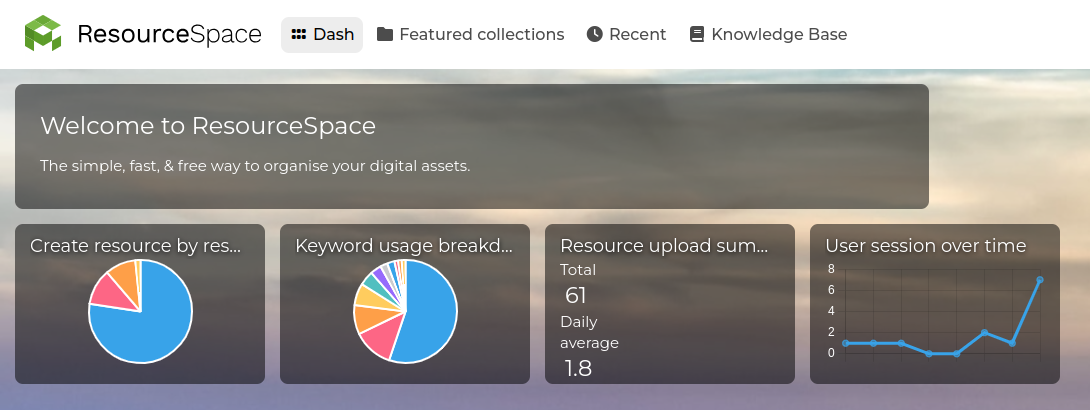
"Add to dash" next to each report graph will add the selected graph to your ResourceSpace home page as a dash tile. This tile can be dragged and dropped to delete or reorder in the same way as any other dash tile.
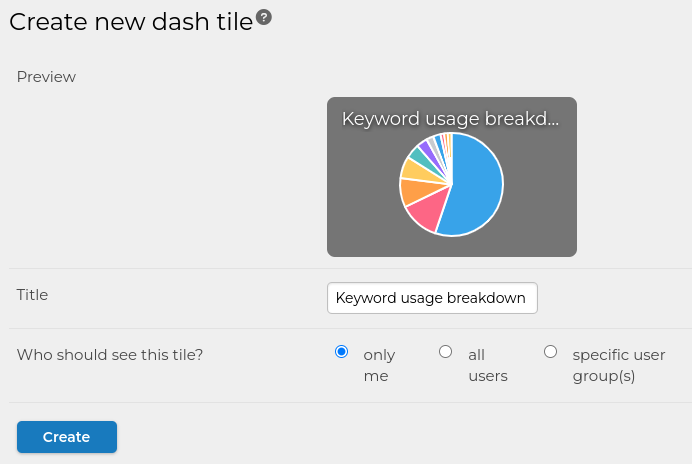
There is the option to add a custom title to the dash tile. This could for example include some of the filter options so it's obvious to you what this represents, such as "User sessions last 30 days".
Note - subsequent changes you make to the report options WILL NOT be reflected on the dash tile as this shows a 'snapshot' of the options at the time the dash tile was created. Clicking on the dash tile will take you to the originating report.